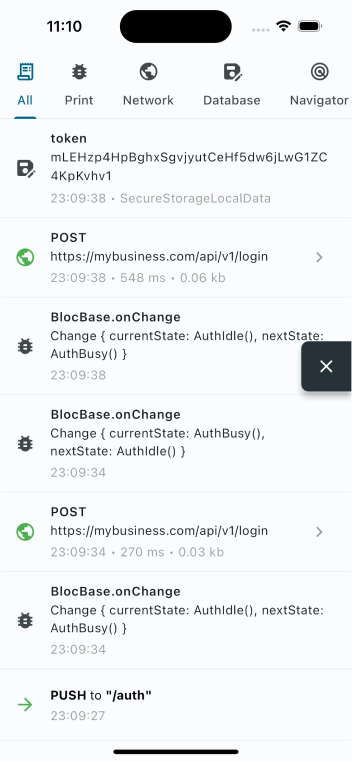
Logarte 是一个功能全面的 Flutter 应用内调试控制台,提供实时日志记录、网络检查、存储监控以及密码保护访问,以保护敏感数据。专为开发者设计,它提供直观的界面,可在 Android、iOS、Web、macOS、Windows 和 Linux 等多个平台上跟踪应用行为,用于开发和测试。该包通过将关键工具整合到一个安全的单一界面中,提升了调试效率,使诊断问题更加便捷,无需完全依赖终端日志。
适合场景
Flutter 应用的实时调试
监控网络请求和响应
检查本地存储和共享首选项
使用密码保护来确保调试工具的安全
在多个平台上测试应用程序行为
主要特点
具有丰富 UI 的应用内调试控制台
网络请求检查器
本地数据存储监控
密码保护访问
跨平台支持(Android、iOS、Web、macOS、Windows、Linux)
适合对象
Flutter 开发者在积极开发中
需要安全调试访问的团队
需要详细运行时诊断的应用程序
涉及敏感数据处理的项目
调试复杂的状态或网络问题
使用建议
不适用于生产发布
在调试模式下需要手动激活
可能会略微增加应用大小
密码必须在运行时设置
限于开发和测试环境
原始 README
以下为关联源码仓库的 README 原文快照,最新内容请访问源码仓库。
logarte
In-app debug console and logger for Flutter apps.
📦 Features
🚀 In-app console: Monitor your app inside your app
🔒 Access control: Optional password protection
📡 Network inspector: Track API calls and responses
📁 Storage monitor: Track local storage operations
📤 Copy & export: Share debug logs with your team
📄 Curl command: Copy cURL command for API requests
📱 Screenshots
Console
API Request
Password
🩵 Sponsors
Want to say "thanks"? Check out our sponsors:
🪚 Usage
Add to pubspec.yaml
dependencies:logarte:^0.2.1
Then run flutter pub get.
Initialize
Create a global Logarte instance:
finalLogarte logarte = Logarte(
// Protect with password
password: '1234',
// Skip password in debug mode
ignorePassword: kDebugMode,
// Share network request
onShare: (String content) {
Share.share(content);
},
// To have logs in IDE's debug console (default is false)
disableDebugConsoleLogs: false,
// Add shortcut actions (optional)
onRocketLongPressed: (context) {
// e.g: toggle theme mode
}
onRocketDoubleTapped: (context) {
// e.g: change language
}
);
Enable the debug console
In debug mode
Ideally, you should attach the floating button to the widget tree, then click it to open the debug console. This is the preferred way because you don't know when you'll need it and sometimes you might need to go back and forth many times. So, it's better to have it on the UI always.
This will attach the floating button when in debug mode. Curious how you can access it in production when it's not debug mode? Check below.
In production
Logarte is as valuable in production mode as it is in debug mode. Whenever you find a bug, notice something not working, API requests failing, etc., you should be able to check the console and find why.
Two ways to access in production:
Hidden gesture trigger
LogarteMagicalTap is a widget that attaches the floating button to the UI when tapped 10 times. Wrap any non-tappable widget, keep it secret, and make sure you've set a password while initializing.
LogarteMagicalTap(
  logarte: logarte,
  child: Text('App Version 1.0'),
)
Manual trigger
You might also have creative ideas on when and how to open the console. For example, I used a shake detection plugin and attached the floating button when the device was shaken 3 times consecutively. From my experience, this is extremely valuable. Why? Imagine: you've opened your app, went to deeper screens, and an API call failed. You say 'Thank God I've already integrated logarte. Let's open that console!' But you need to go to the page where you used LogarteMagicalTap, which might be too far or not visible at that stage of the app - maybe you're showing it on the profile page and you are on the login page. So be creative about where to add it and consider using shake detection or anything that would serve you better.
logarte.openConsole(context);
Different from the .attach(context) method, this will directly open the console (password page if set, else the console itself).
While initializing, you can pass a custom tab widget to the Logarte instance. This tab will be shown in the console.
This is useful when you want to add a custom tab to the console, for example, to change the environment, copy device's FCM token, clear local cache, etc.