搜索插件、代码仓与 APP 分类

k_chart_plus_deeping 封面
插件详情v1.0.2-5.2.2.3

k_chart_plus_deeping

用于交易所应用中绘制K线图和深度图的图表库,拥有丰富经验的软件开发人员,欢迎通过 Telegram @sandaohaizi 联系我。

AndroidiOSWebmacOSWindowsLinux
近 30 天下载
103
喜欢数
120
Pub 分数
140

安装插件

flutter pub add k_chart_plus_deeping

插件介绍

基于插件公开信息、社区数据与项目使用情况整理的选型参考。

k_chart_plus_deeping 是一个专为构建高级金融图表而设计的 Flutter 包,包括适合交易所应用的蜡烛图和深度图。它提供流畅且可自定义的可视化效果,并支持实时数据更新。专为有经验的开发者打造,可无缝集成到跨多平台的交易或金融类应用中。该库是开源的,由一位欢迎通过 Telegram 合作的开发者维护。

适合场景

  • 交易平台接口
  • 加密货币交易所仪表板
  • 实时市场数据可视化
  • 财务分析工具
  • 投资组合跟踪应用程序

主要特点

  • K线图渲染
  • 深度图可视化
  • 跨平台兼容性
  • 高性能渲染
  • 可自定义的主题和样式
  • 实时数据流支持

适合对象

  • 有经验的 Flutter 开发人员
  • 金融与加密货币应用构建者
  • 交易所平台团队
  • 数据可视化专家
  • 需要交互式图表的应用程序

使用建议

  • 需要了解金融图表概念
  • 最适合复杂的交易UI
  • 可能需要额外的状态管理
  • 除 GitHub 仓库外,文档有限
  • 需要 Telegram 联系人以获取直接支持

原始 README

以下为关联源码仓库的 README 原文快照,最新内容请访问源码仓库。

K Chart Plus Package Deeping

简体中文 | English

Feature

2024-08-01 Update: Display double volume
2024-07-18 Update: Gesture zoom functionality | Scientific notation support
2024-07-17 Update: EMA indicator added
2024-07-16 Update: Skeleton screen functionality

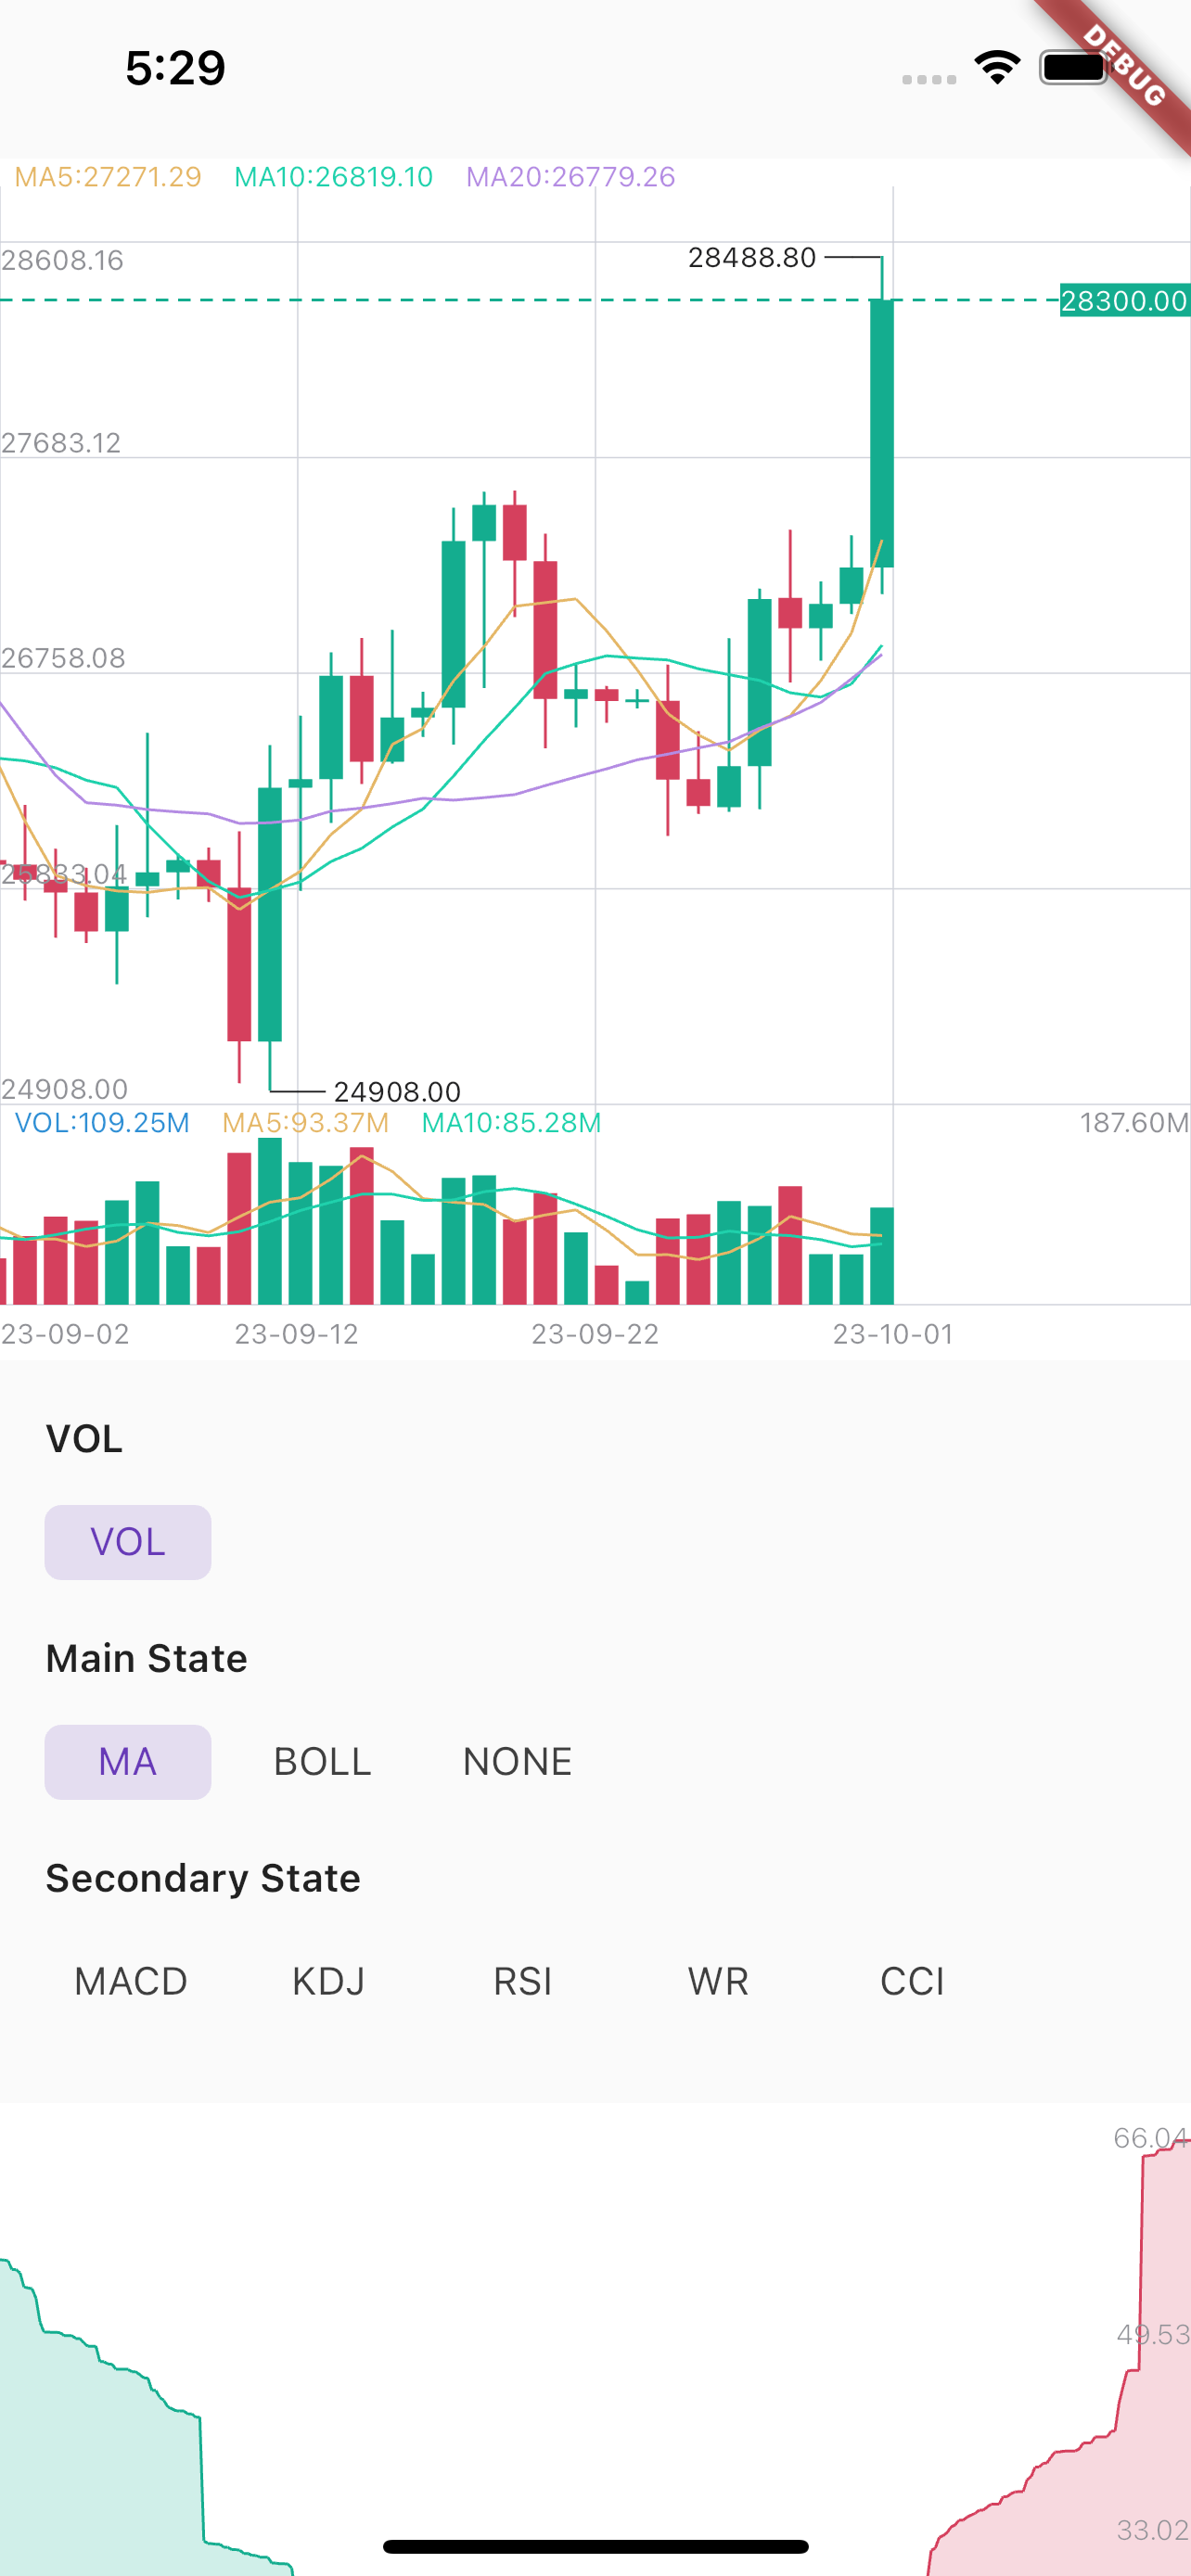
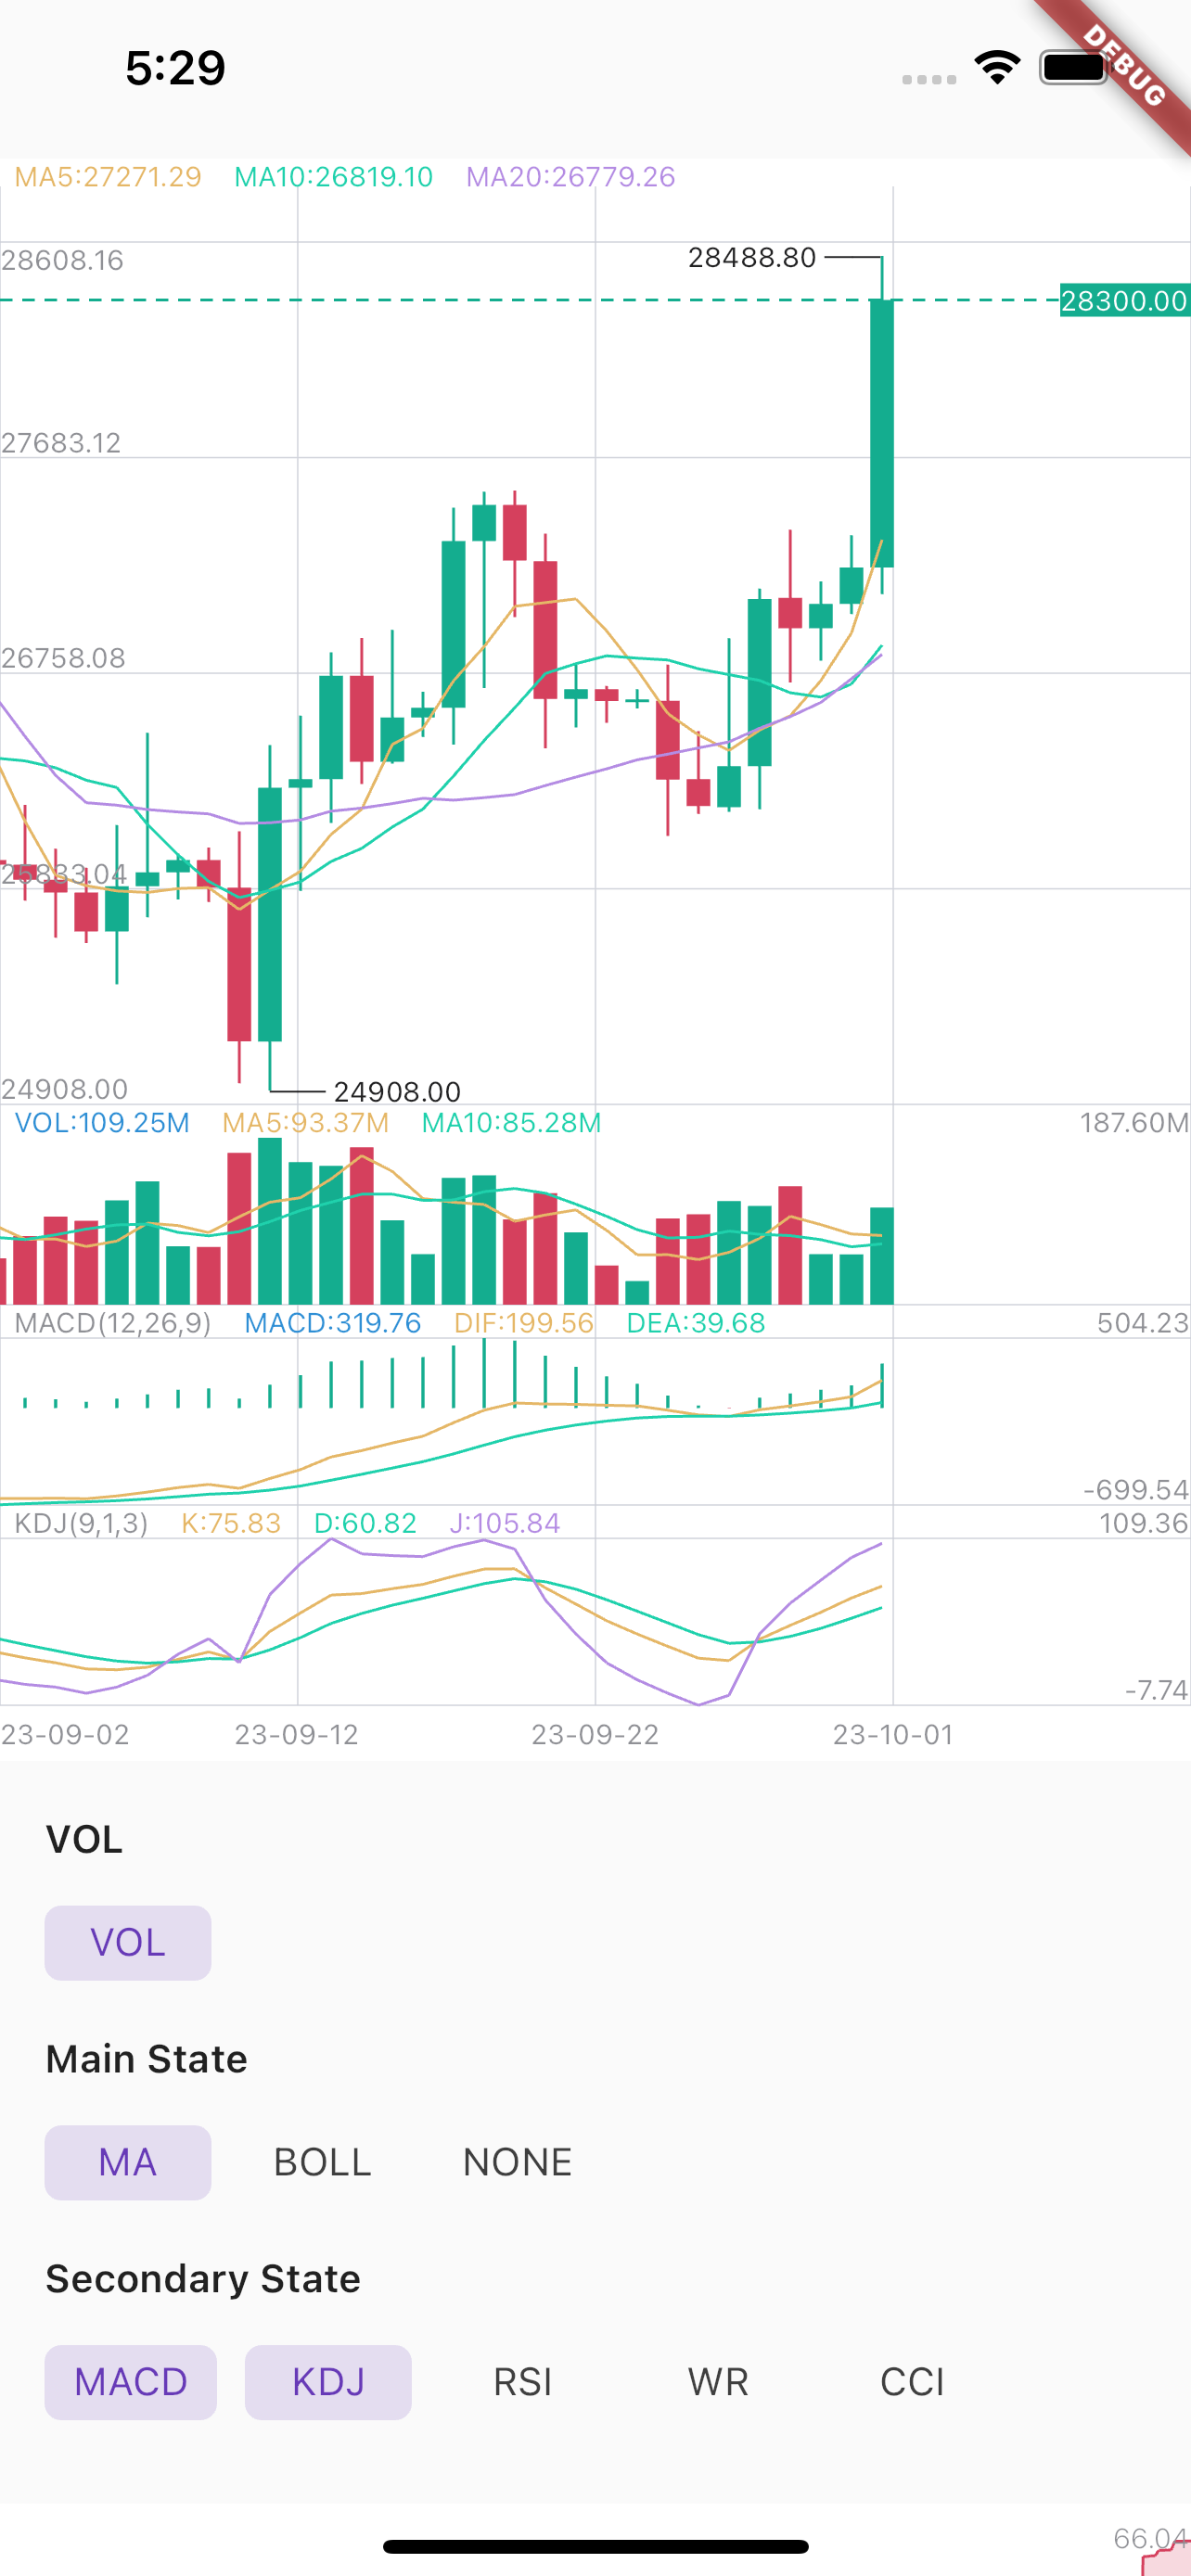
Maybe this is the best k chart in Flutter.Support drag,scale,long press,fling.And easy to use.

Example1 Example2

Installation

First, add k_chart_plus as a dependency in your pubspec.yaml file.

k_chart_plus_deeping: ^1.0.0-tomo+2

If you don't want to support selecting multiple secondary states, you need to use:

flutter_k_chat_plus:
   git:
     url: https://github.com/sawwas/flutter_k_chat_plus
     ref: single #branch name

Usage

When you change the data, you must call this:

DataUtil.calculate(datas); //This function has some optional parameters: n is BOLL N-day closing price. k is BOLL param.
Use K line chart
KChartWidget(
    chartStyle, // Required for styling purposes
    chartColors,// Required for styling purposes
    datas,// Required,Data must be an ordered list,(history=>now)
    mBaseHeight: 360, //height of chart (not contain Vol and Secondary) 
    isLine: isLine,// Decide whether it is k-line or time-sharing
    mainState: _mainState,// Decide what the main view shows
    secondaryStateLi: _secondaryStateLi,// Decide what the sub view shows
    fixedLength: 2,// Displayed decimal precision
    timeFormat: TimeFormat.YEAR_MONTH_DAY,
    onLoadMore: (bool a) {},// Called when the data scrolls to the end. When a is true, it means the user is pulled to the end of the right side of the data. When a
    // is false, it means the user is pulled to the end of the left side of the data.
    maDayList: [5,10,20],// Display of MA,This parameter must be equal to DataUtil.calculate‘s maDayList
    volHidden: false,// hide volume
    showNowPrice: true,// show now price
    isOnDrag: (isDrag){},// true is on Drag.Don't load data while Draging.
    isTrendLine: false, // You can use Trendline by long-pressing and moving your finger after setting true to isTrendLine property. 
    xFrontPadding: 100 // padding in front
),
Use Depth chart
DepthChart(_bids, _asks, chartColors) //Note: Datas must be an ordered list,
Dark | Light Theme

ChartColor helped to set the color for the chart. You need to flexibly change according to your theme configuration to ensure UI.

If you need to apply multi theme, you need to change at least the colors related to the text, border, grid and background color

late ThemeData themeData = Theme.of(context);
late ChartColors chartColors = ChartColors(
  bgColor: themeData.colorScheme.background,
  defaultTextColor: themeData.textTheme.labelMedium?.color ?? Colors.grey,
  gridColor: themeData.dividerColor,
  hCrossColor: themeData.textTheme.bodyMedium?.color ?? Colors.white,
  vCrossColor: themeData.disabledColor.withOpacity(.1),
  crossTextColor: themeData.textTheme.bodyMedium?.color ?? Colors.white,
  selectBorderColor: themeData.textTheme.bodyMedium?.color ?? Colors.black54,
  selectFillColor: themeData.colorScheme.background,
  infoWindowTitleColor: themeData.textTheme.labelMedium?.color ?? Colors.grey,
  infoWindowNormalColor: themeData.textTheme.bodyMedium?.color ?? Colors.white,
);

Apply in k line chart:


KChartWidget(
    data,
    ChartStyle(),
    ChartColors().init(), ///custom chart color
    chartTranslations: ChartTranslations(
        date: 'Date'
        open: 'Open',
        high: 'High',
        low: 'Low',
        close: 'Close'
        changeAmount: 'Change',
        change: 'Change%',
        amount: 'Amount',
        vol: 'Volume',
    ),
    mBaseHeight: 360,
    isTrendLine: false,
    mainState: mainState,
    secondaryStateLi: secondaryStates,
    fixedLength: 2,
    timeFormat: TimeFormat.YEAR_MONTH_DAY,
);
Thanks

TrangLeQuynh/k_chart_plus

gwhcn/flutter_k_chart

OpenFlutter/k_chart

所属分类

依赖

依赖清单 3 项

源码仓库

使用此插件的项目

暂无相关数据。