
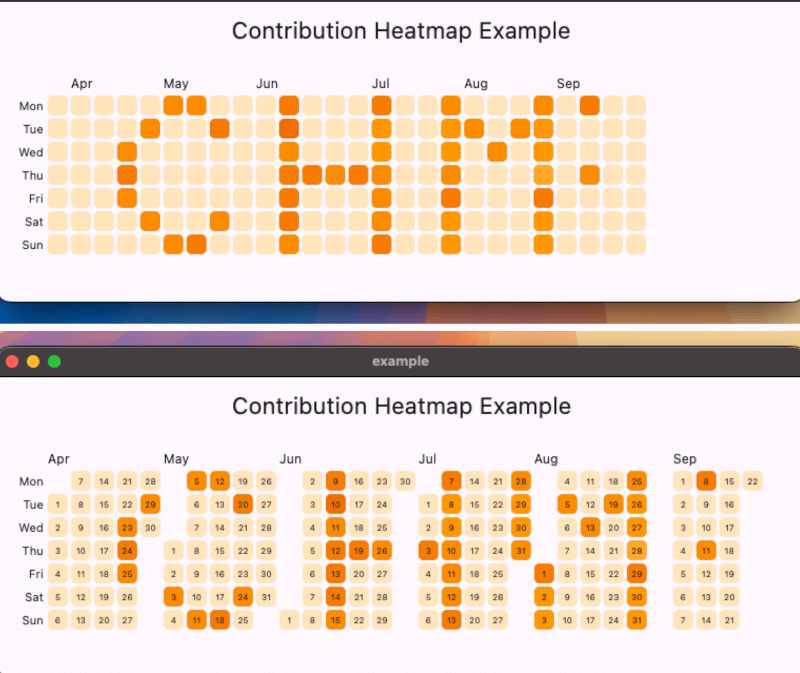
Overview
A high-performance, GitHub-style contribution heatmap calendar widget for Flutter. Built with a custom RenderBox for optimal efficiency and smooth rendering, it enables developers to visualize user activity over time with full customization options. Ideal for dashboards, analytics apps, or personal productivity tools, the widget supports dynamic data updates and responsive design across all platforms. It mirrors GitHub's popular contribution graph, offering a familiar and intuitive interface for tracking progress.
Use cases
- User activity tracking
- Productivity dashboards
- Developer analytics
- Progress visualization
- Team performance monitoring
Key features
- Custom RenderBox for high performance
- Full theme and style customization
- Responsive layout across platforms
- Dynamic data updates
- Supports multiple color schemes
- Smooth animations
Suitable for
- Analytics applications
- Developer tools
- Personal habit trackers
- Dashboard widgets
- Cross-platform apps
Considerations
- Requires manual data mapping for contributions
- Limited built-in interactivity
- Best suited for static or periodic data
- May need additional styling for complex themes
- Not optimized for very large datasets