Package selection guidance compiled from public package information, community data, and project usage.
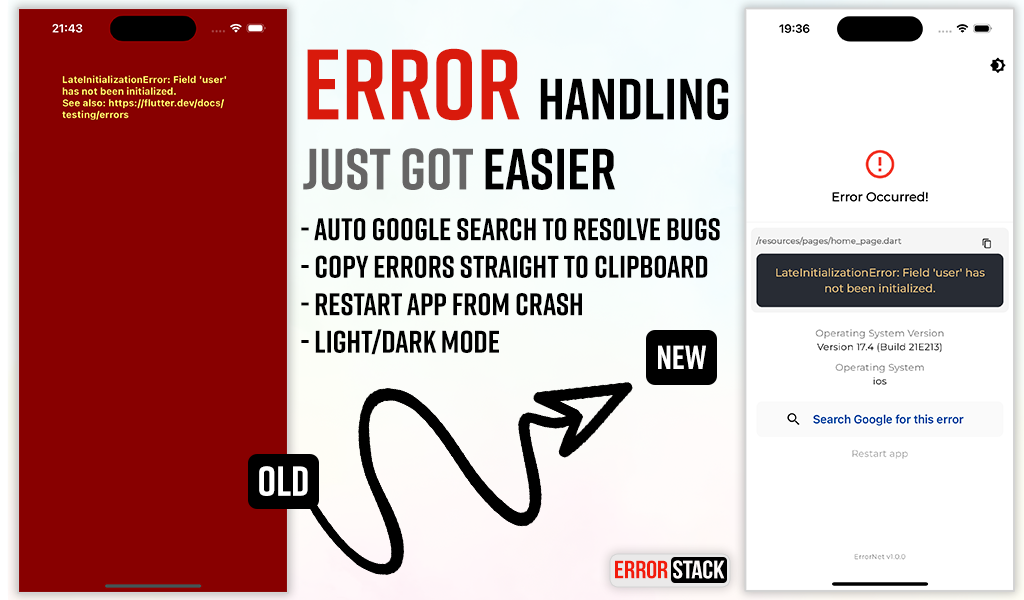
ErrorStack is a Flutter package designed to streamline error handling in applications by providing customizable UIs for displaying errors and robust logging capabilities. It helps developers quickly identify and resolve issues during development and production, improving debugging efficiency. With support across multiple platforms, it integrates seamlessly into existing workflows. The package enhances productivity by offering clear, actionable feedback when exceptions occur.
Use cases
Debugging runtime errors
Displaying user-friendly error messages
Logging exceptions for analysis
Improving app stability
Monitoring crashes in production
Enhancing developer workflow
Key features
Customizable error UI
Built-in error logging
Cross-platform support
Easy integration with Flutter apps
Real-time error reporting
Configurable error handling behavior
Suitable for
Flutter developers
Teams using CI/CD pipelines
Apps requiring robust error monitoring
Developers focused on UX during failures
Projects with strict error tracking needs
Frontend teams prioritizing debugging speed
Considerations
Requires configuration for full functionality
May increase app size slightly
Depends on proper setup for logging
Not intended for production-only use without customization
Limited to error display and logging scope
Best used alongside other monitoring tools
Original README
Original README snapshot from the linked source repository. Visit the repository for the latest content.
Error Stack for Flutter
Error Stack is a comprehensive error handling and debugging toolkit for Flutter. It provides beautiful error screens in debug mode with actionable information, customizable error pages for production, and a powerful dev panel for runtime debugging.
Features
Beautiful debug error screens with Google search links and stack traces
Customizable production error pages
Light and dark mode support
Dev Panel - Runtime debugging tool with:
API request/response logging
Console logging with severity levels
Navigation route tracking
Local storage viewer (Secure Storage & Shared Preferences)
UI debugging overlays (grid, layout bounds, etc.)
Dio interceptor for automatic HTTP logging
SOLID architecture with dependency injection support
Option 1: Long-press the "Dev Mode" bar at the bottom of the screen
Option 2: Call programmatically:
ErrorStack.showDevPanel(context);
API Tab
View HTTP requests and responses with timing, headers, and body data.
Dio Integration
import'package:error_stack/error_stack_dio.dart';
final dio = Dio();
dio.interceptors.add(ErrorStackDioInterceptor());
// All requests are automatically loggedfinal response = await dio.get('https://api.example.com/users');
Console logs with filtering by severity level. Tap the copy icon on any log entry to copy the full entry (level, timestamp, tag, message, and stack trace) to the clipboard.
import'package:error_stack/error_stack.dart';
// Log at different levelsDevPanelStore.instance.debug('Debug message');
DevPanelStore.instance.info('User logged in', tag: 'auth');
DevPanelStore.instance.warning('Cache miss for key');
DevPanelStore.instance.error('Failed to load data', stackTrace: trace.toString());
// With metadataDevPanelStore.instance.info(
'Payment processed',
tag: 'payments',
metadata: {'amount': 99.99, 'currency': 'USD'},
);
Routes Tab
Navigation history with route names, arguments, and actions. Tap a route to open its details sheet, where you can copy the route name to the clipboard.
Route tracking is automatic when using ErrorStackNavigatorObserver:
View all local storage data from both Secure Storage and Shared Preferences. Tap an entry to open the edit modal, where you can copy the key or value to the clipboard or update the stored value.
UI Debug Tools
The dev panel includes visual debugging overlays:
Tool
Description
Grid Paper
Overlay grid for alignment checking
Layout Bounds
Show widget boundaries
Text Scale
Override text scale (0.5-3.0x)
Color Blindness
Simulate protanopia, deuteranopia, tritanopia
Slow Animations
5x animation slowdown
Performance Overlay
Flutter performance metrics
Safe Areas
Visualize safe area boundaries
Control programmatically:
final store = DevPanelStore.instance;

store.toggleGridPaper(true);
store.setGridSpacing(24.0);
store.toggleLayoutBounds(true);
store.setTextScaleFactor(1.5);
store.setColorBlindnessMode(ColorBlindnessMode.protanopia);
store.toggleSlowAnimations(true);
store.togglePerformanceOverlay(true);
store.toggleSafeAreas(true);

// Reset all to defaults
store.resetUIDebugSettings();
Architecture
Error Stack follows SOLID principles with a modular design: