
Overview
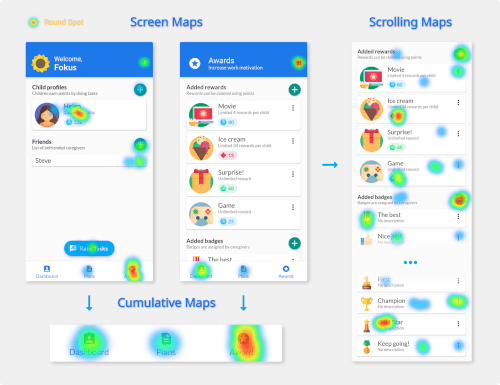
Round Spot is a customizable and user-friendly heat map interface analysis library designed for visualizing data patterns across various platforms. It enables developers to easily integrate interactive heat maps into their applications, supporting Android, iOS, Web, macOS, Windows, and Linux. Ideal for analytics and consumer insights, it helps identify user behavior hotspots through intuitive visualization. The library is lightweight and straightforward to implement, making it accessible for both beginners and experienced developers.
Use cases
- User behavior tracking
- Interactive data visualization
- A/B testing analysis
- Customer journey mapping
- Heatmap-based UX research
- Real-time analytics dashboards
Key features
- Cross-platform compatibility
- Highly customizable heat map styles
- Simple integration with Flutter
- Real-time data updates
- Responsive design support
- Built-in interaction events
Suitable for
- UX researchers
- Product analysts
- Flutter developers
- Data visualization projects
- Testing and feedback tools
- Analytics dashboard builders
Considerations
- Requires understanding of heat map principles
- May need additional styling for complex UIs
- Performance impact with large datasets
- Limited built-in data processing
- Dependent on external data sources
- Not optimized for non-interactive use cases